
Make better decisions before,
and after a trade

Trusted by thousands of traders
200,000+
Downloads worldwide
25,000+
Monthly active users
Rated 4.7 on the App Store
Connect the platform you trade on


+400 more
A chart is only part of the trade. The setup also depends on the market around it, the strategy you’re trying to follow, and how you’ve traded
situations like it before.
Profit AI brings that together before you enter, and keeps the result after you close. Over time it doesn’t just understand the market. It understands how
you trade.
Chart & Market Data
Live OHLCV · Snapshot · News ·
Macro · Earnings
Your Strategy
Entry criteria · Exit rules · Risk · Filters · Timeframe
Your Performance
Trades · Patterns · Behavior ·
Past analyses & outcomes
Before the trade,
see the whole picture.
Bring your chart, your strategy, and your trading history together. Get an analysis grounded in the setup in front of you and the way you actually trade.
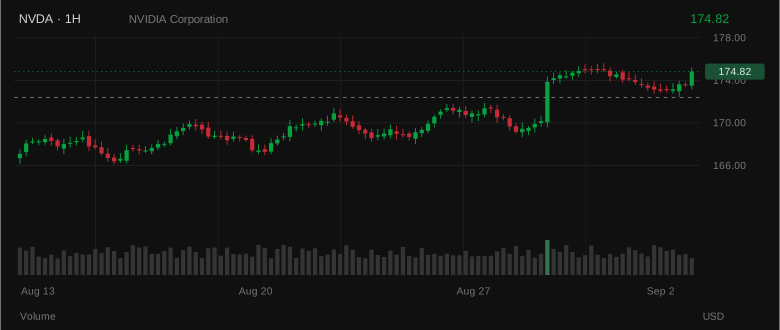
Get Started176.84 +1.80%
Understand the setup.
Know your next move.
Understand what supports a setup, what works against it, and whether it fits your plan. Clear entry, stop, and target levels help you decide when to act and when to wait.
Get StartedA healthy uptrend, with a better entry still ahead. Let price return to $174 before committing.
Buyers keep stepping in at higher prices, a sign the uptrend is intact.
Selling has slowed on the pullback, while price holds above the 20-day average.
Buying now leaves just 1.3× your risk in upside. At $174, that improves to 3×.
A break below $170 would end the pattern of higher lows and cancel the setup.
Close the trade.
Keep the lesson.
Go beyond the final P&L. Review your execution against your plan, capture how you felt, and understand which decisions are worth repeating.
Get StartedWaiting for the reclaim gave you a $4 stop and $12 of upside. The entry and the direction together made this a 3R trade.
You entered after buyers defended support, rather than on the first touch.
Pair a patient entry with a predefined exit. Buying at $176.84 would have reduced this same move to just 1.3R.
Let the first move go. Entered on confirmation, then gave the plan room to work.
Find the patterns
in your performance.
See which setups, sessions, and habits bring out your best trading. Turn a growing trade history into a clearer picture of where your edge comes from.
Get StartedPullbacks are your edge.
36 winners from 48 trades. Your most productive setup.
+$18,000 netChasing gives it back.
Late entries lost money despite your overall progress.
−$2,400 · 20 tradesLet price come to you.
Mark your entry first. If you miss the move, wait for a retest.
One rule to take forwardPerformance by setup
Average P&L per trade
Entry discipline
Average P&L per trade
Same trader. A different entry habit.
See how far
your process takes you.
Follow your equity, consistency, and discipline in one place. See whether better decisions are showing up in your results, and know what to work on next.
Get StartedTrade with more clarity
Profit AI does the heavy lifting so you can focus on the trade. Snap, analyze, journal. All in under a minute.
 Step 1
Snap or upload a chart
Use your camera to capture a chart, or import a screenshot from your photo library.
 Step 2
Get a precise AI breakdown
Technical analysis, market news, sentiment, and your custom strategy applied to every chart in seconds.
 Step 3
Journal, score, and improve
Log every trade, review your patterns, and learn from a personal AI mentor in real time.
Trade smarter.
Starting today.
Join 200K+ traders making smarter moves with real-time AI analysis, intelligent journaling, and a personal AI mentor.